Risk-Conditioned Macro Allocation for Trend & Mean Reversion
A dynamic allocator that routes capital between Trend, Mean Reversion and Cash sleeves based on real-time volatility and autocorrelation signals, with VaR and drawdown overlays to cap tail risk.
Performance Snapshot
| Metric | Buy & Hold SPY | Fixed 50/50 | Risk-Managed |
|---|---|---|---|
| CAGR | 9.8% | 2.0% | 4.1% |
| Volatility | 19.5% | 3.9% | 9.1% |
| Sharpe | 0.35 | −0.26 | 0.12 |
| Max Drawdown | −55.2% | −10.9% | −15.4% |
| Worst 5-day Loss | −18.3% | −3.3% | −3.6% |
TL;DR
- Built two simple cross-asset trading sleeves on a 5-ETF universe (SPY, TLT, GLD, USO, UUP): a Trend sleeve (long when price > 100-day SMA) and a Mean-reversion sleeve (Bollinger-band rule buying dips below −2σ, selling rallies above +2σ).
- Constructed a risk-state engine on the equal-weighted market return using EWMA volatility to detect high-risk regimes, 20-day rolling autocorrelation to distinguish trend, mean-reversion and noise, and parametric 1-day 95% VaR and 5-day drawdown to cap tail risk.
- Allocated capital between Trend, Mean Reversion and Cash via a signal-to-noise playbook: High vol & positive autocorr → fund Trend; High vol & negative autocorr → fund Mean Reversion; High vol & low autocorr → cut risk to Cash; Low vol → 50/50 diversified mix.
- Applied volatility targeting, VaR scaling and a drawdown breaker on top: each sleeve targets 10% annualised vol, portfolio VaR capped at 2% of equity, and if 5-day drawdown breaches −3%, all risk is cut in half until the book stabilises.
- The allocator sacrifices some long-run CAGR versus fully invested SPY, but decapitates crash risk: drawdowns capped around −15% and worst 5-day loss only −3.6%. With the same underlying alpha rules, intelligent risk budgeting delivers a smoother, more leverage-able return stream.
What this demonstrates
- Building a risk-state engine on top of simple signals. Uses only daily prices, yet recovers a rich risk taxonomy (trend, mean-reversion, noise, high vs low vol) through EWMA volatility and rolling autocorrelation, then turns those diagnostics into capital-allocation decisions.
- Separating alpha from risk management. The trading rules are deliberately plain-vanilla (100-day SMA trend, 20-day Bollinger mean reversion). Any performance difference between the naïve 50/50 blend and the allocator comes from risk budgeting, not more complex signals.
- Daily-frequency risk management similar to a real desk. All overlays (vol targeting, VaR cap, drawdown breaker) operate at daily frequency, mirroring how risk is actually monitored in a systematic macro book even when underlying alpha moves slowly.
- Combining multiple overlays: volatility, VaR, drawdown and cash. Shows how to layer volatility targeting on each sleeve, a VaR budget on the aggregate book, and a short-horizon drawdown breaker, while treating unallocated capital as a yield-bearing asset.
- Framing results in portfolio terms, not just strategy PnL. Compares full distributions (vol, Sharpe, Sortino, worst 5-day loss, drawdowns) rather than just CAGRs, and explains why the allocator's lower risk profile could be attractive when levered inside a larger portfolio.
Pipeline
Key Visuals
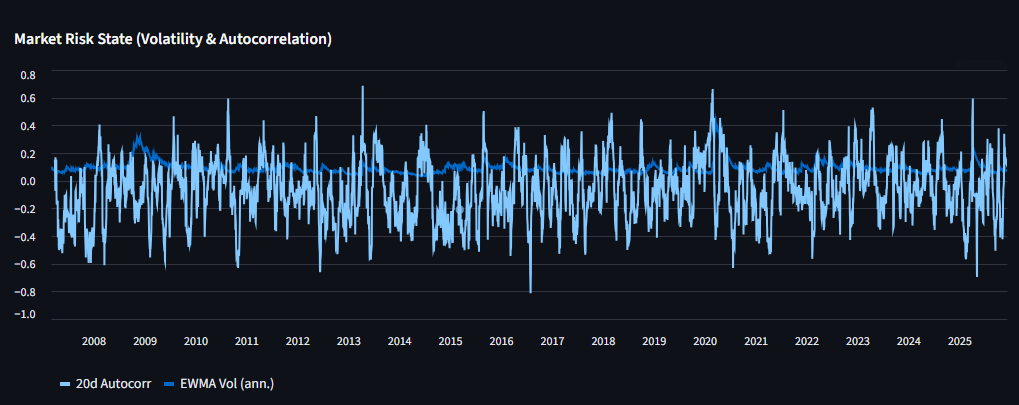
Market risk state showing EWMA volatility and 20-day rolling autocorrelation from 2008-2025.
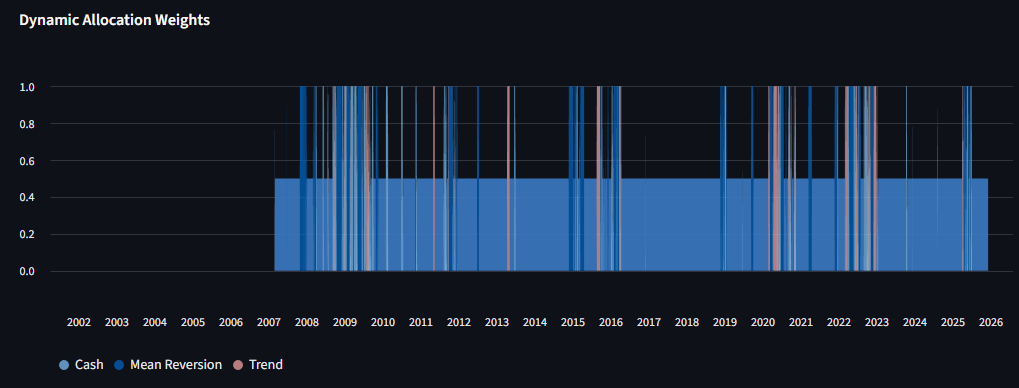
Dynamic allocation weights between Cash, Mean Reversion, and Trend sleeves over time.
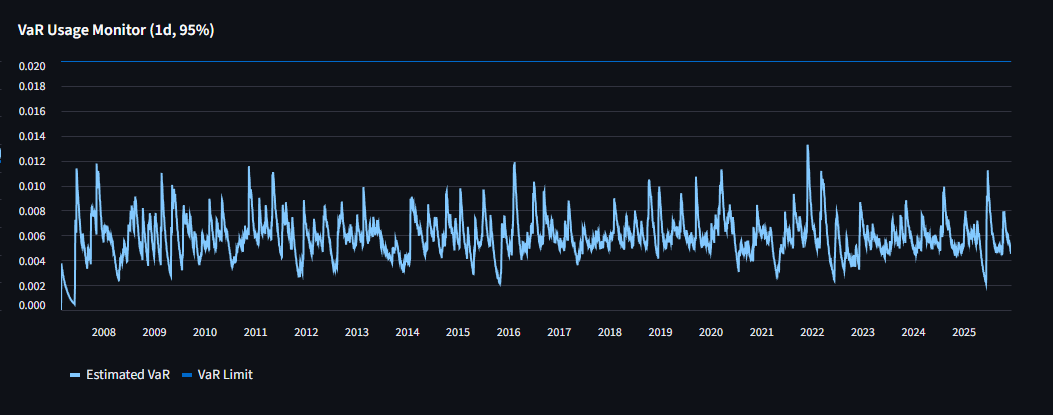
VaR usage monitor showing estimated VaR against the 2% limit threshold.
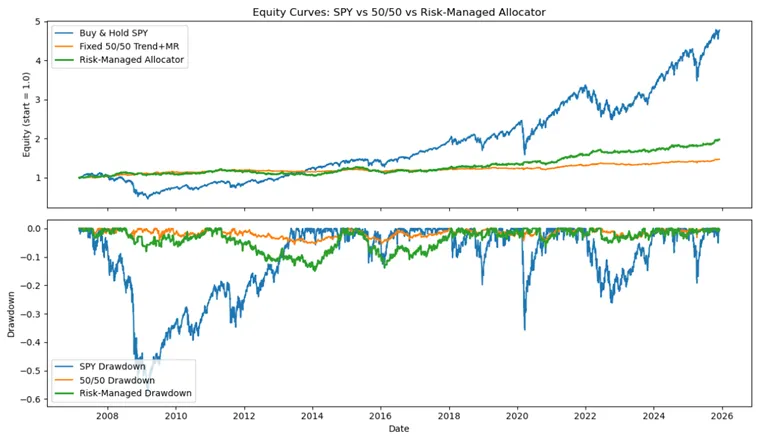
Equity curves comparing SPY, 50/50 Fixed, and Risk-Managed Allocator with drawdown analysis.
Appendix: How the Risk Engine Works
Returns and Market Proxy
All returns are computed from daily adjusted close prices:
The "market" return is the simple equal-weighted average across the five ETFs (SPY, TLT, GLD, USO, UUP). This series is used to define the global risk state (volatility and autocorrelation) that drives allocation between sleeves.
EWMA Volatility
To track time-varying risk, we estimate an Exponentially Weighted Moving Average (EWMA) variance:
with λ = 0.94 (similar to RiskMetrics). Recent returns receive more weight than distant history. Vol spikes quickly in crises and decays gradually as markets calm. A high-vol threshold is set at the 75th percentile of historical EWMA vol.
Rolling Autocorrelation (Signal vs Noise)
Volatility tells you how much markets move, not how usable that movement is. To detect structure vs noise, we compute a rolling lag-1 autocorrelation over a 20-day window:
- • ρ > 0.10: Trend state – returns are positively autocorrelated
- • ρ < −0.10: Mean-reversion state – returns are negatively autocorrelated
- • |ρ| ≤ 0.10: Noise state – near random-walk
Parametric VaR
To enforce a hard risk budget, the framework monitors parametric 1-day 95% Value-at-Risk (VaR):
A VaR limit of 2% of equity is enforced. If VaR exceeds this, all risky positions are scaled down proportionally. This behaves like a risk-budgeting overlay: the more volatile the book becomes, the smaller the gross exposures allowed.
Drawdown Breaker
VaR is forward-looking but model-dependent. To capture realised pain, we add a short-horizon drawdown breaker. If the 5-day drawdown breaches −3%, all exposures are halved until the book stabilises. This mimics a risk manager forcing the desk to cut risk when losses accelerate.
Putting It Together
On each day:
- Determine risk state from EWMA vol and rolling autocorr (trend / MR / noise, high vs low vol)
- Set allocation weights via the signal-to-noise playbook
- Apply sleeve-level vol targeting to get trend and MR scaling
- Compute pre-overlay portfolio return from scaled sleeves
- Apply VaR scaling and drawdown scaling
- Route residual capital to cash, earning 3% risk-free rate
The result is a portfolio that can turn risk off when the tape is noisy or stressed, lean into trend or mean reversion when those structures are strong, and respect explicit risk budgets at all times.