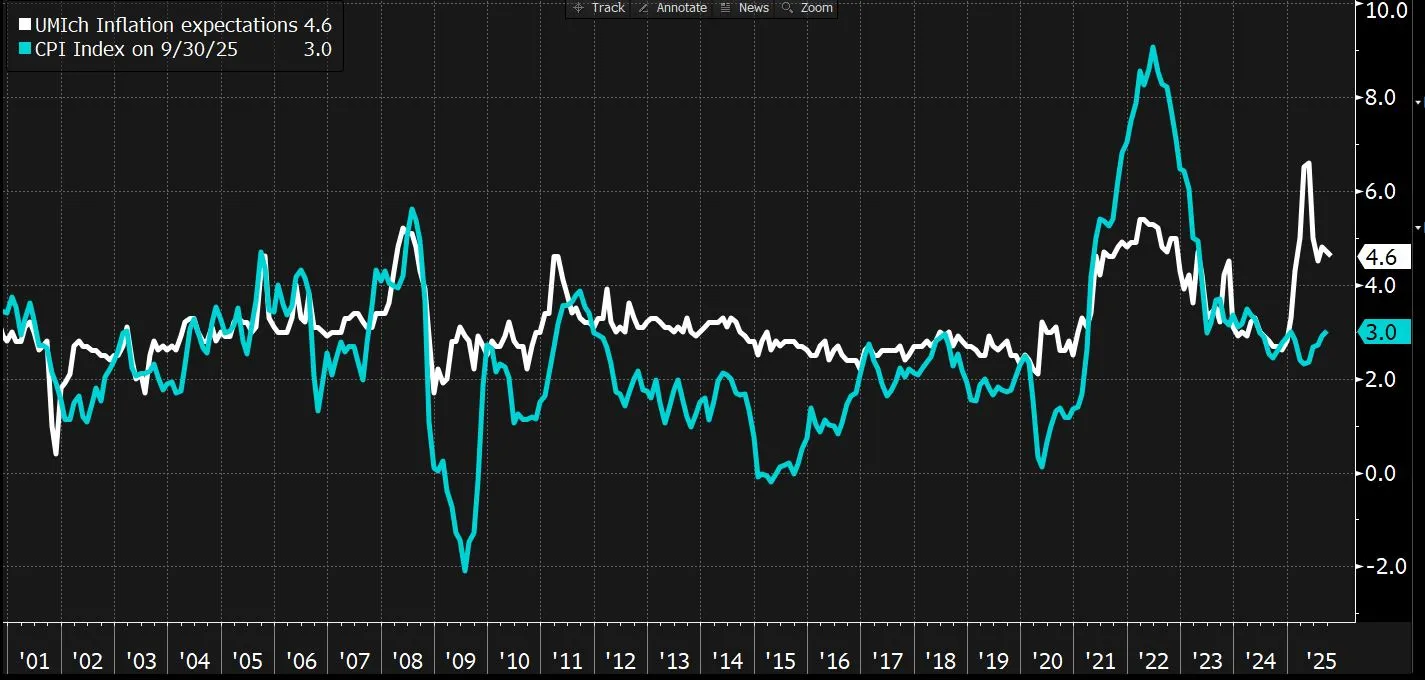
Macro Intelligence Dashboard
Cloud-hosted monitoring system replacing expensive terminal workflows with automated pipelines and real-time analytics
TL;DR
Built: Cloud-hosted macro terminal covering Inflation/Rates/Credit/Growth
Trust: Daily refresh + last refresh timestamp + series count
Workflow: Snapshot → Drivers → History (Grafana layout)
Stack: FRED → Python ingest → Postgres → Grafana
Live Dashboards
Key Visuals
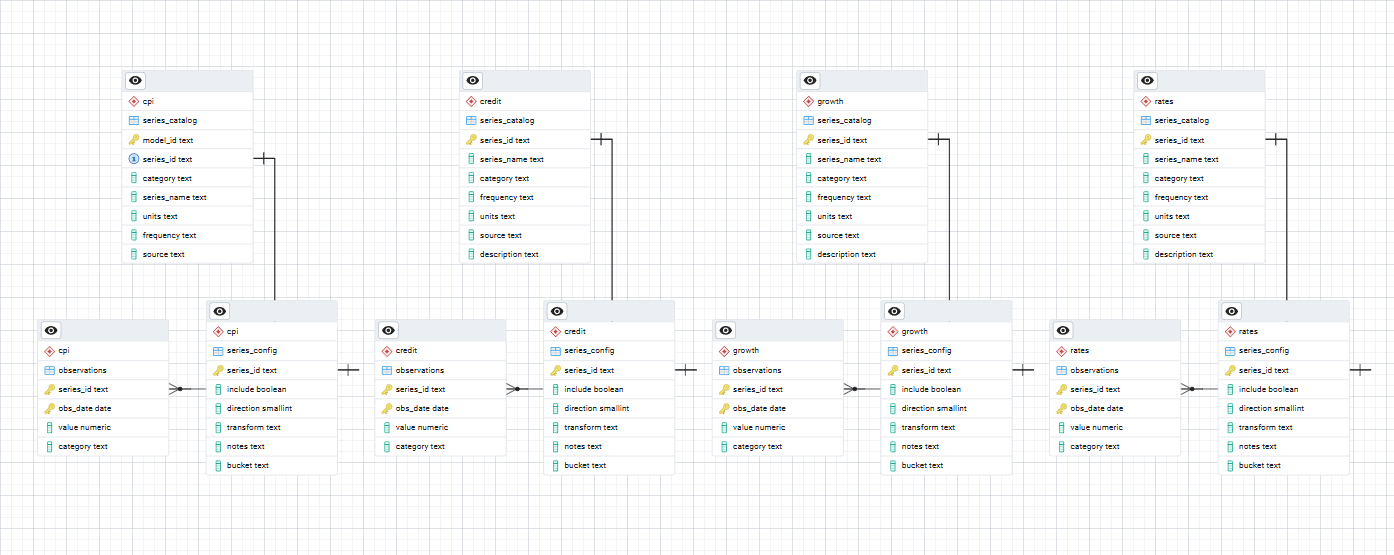
Modular database schema with separate tables for CPI, Credit, Rates, and Growth series
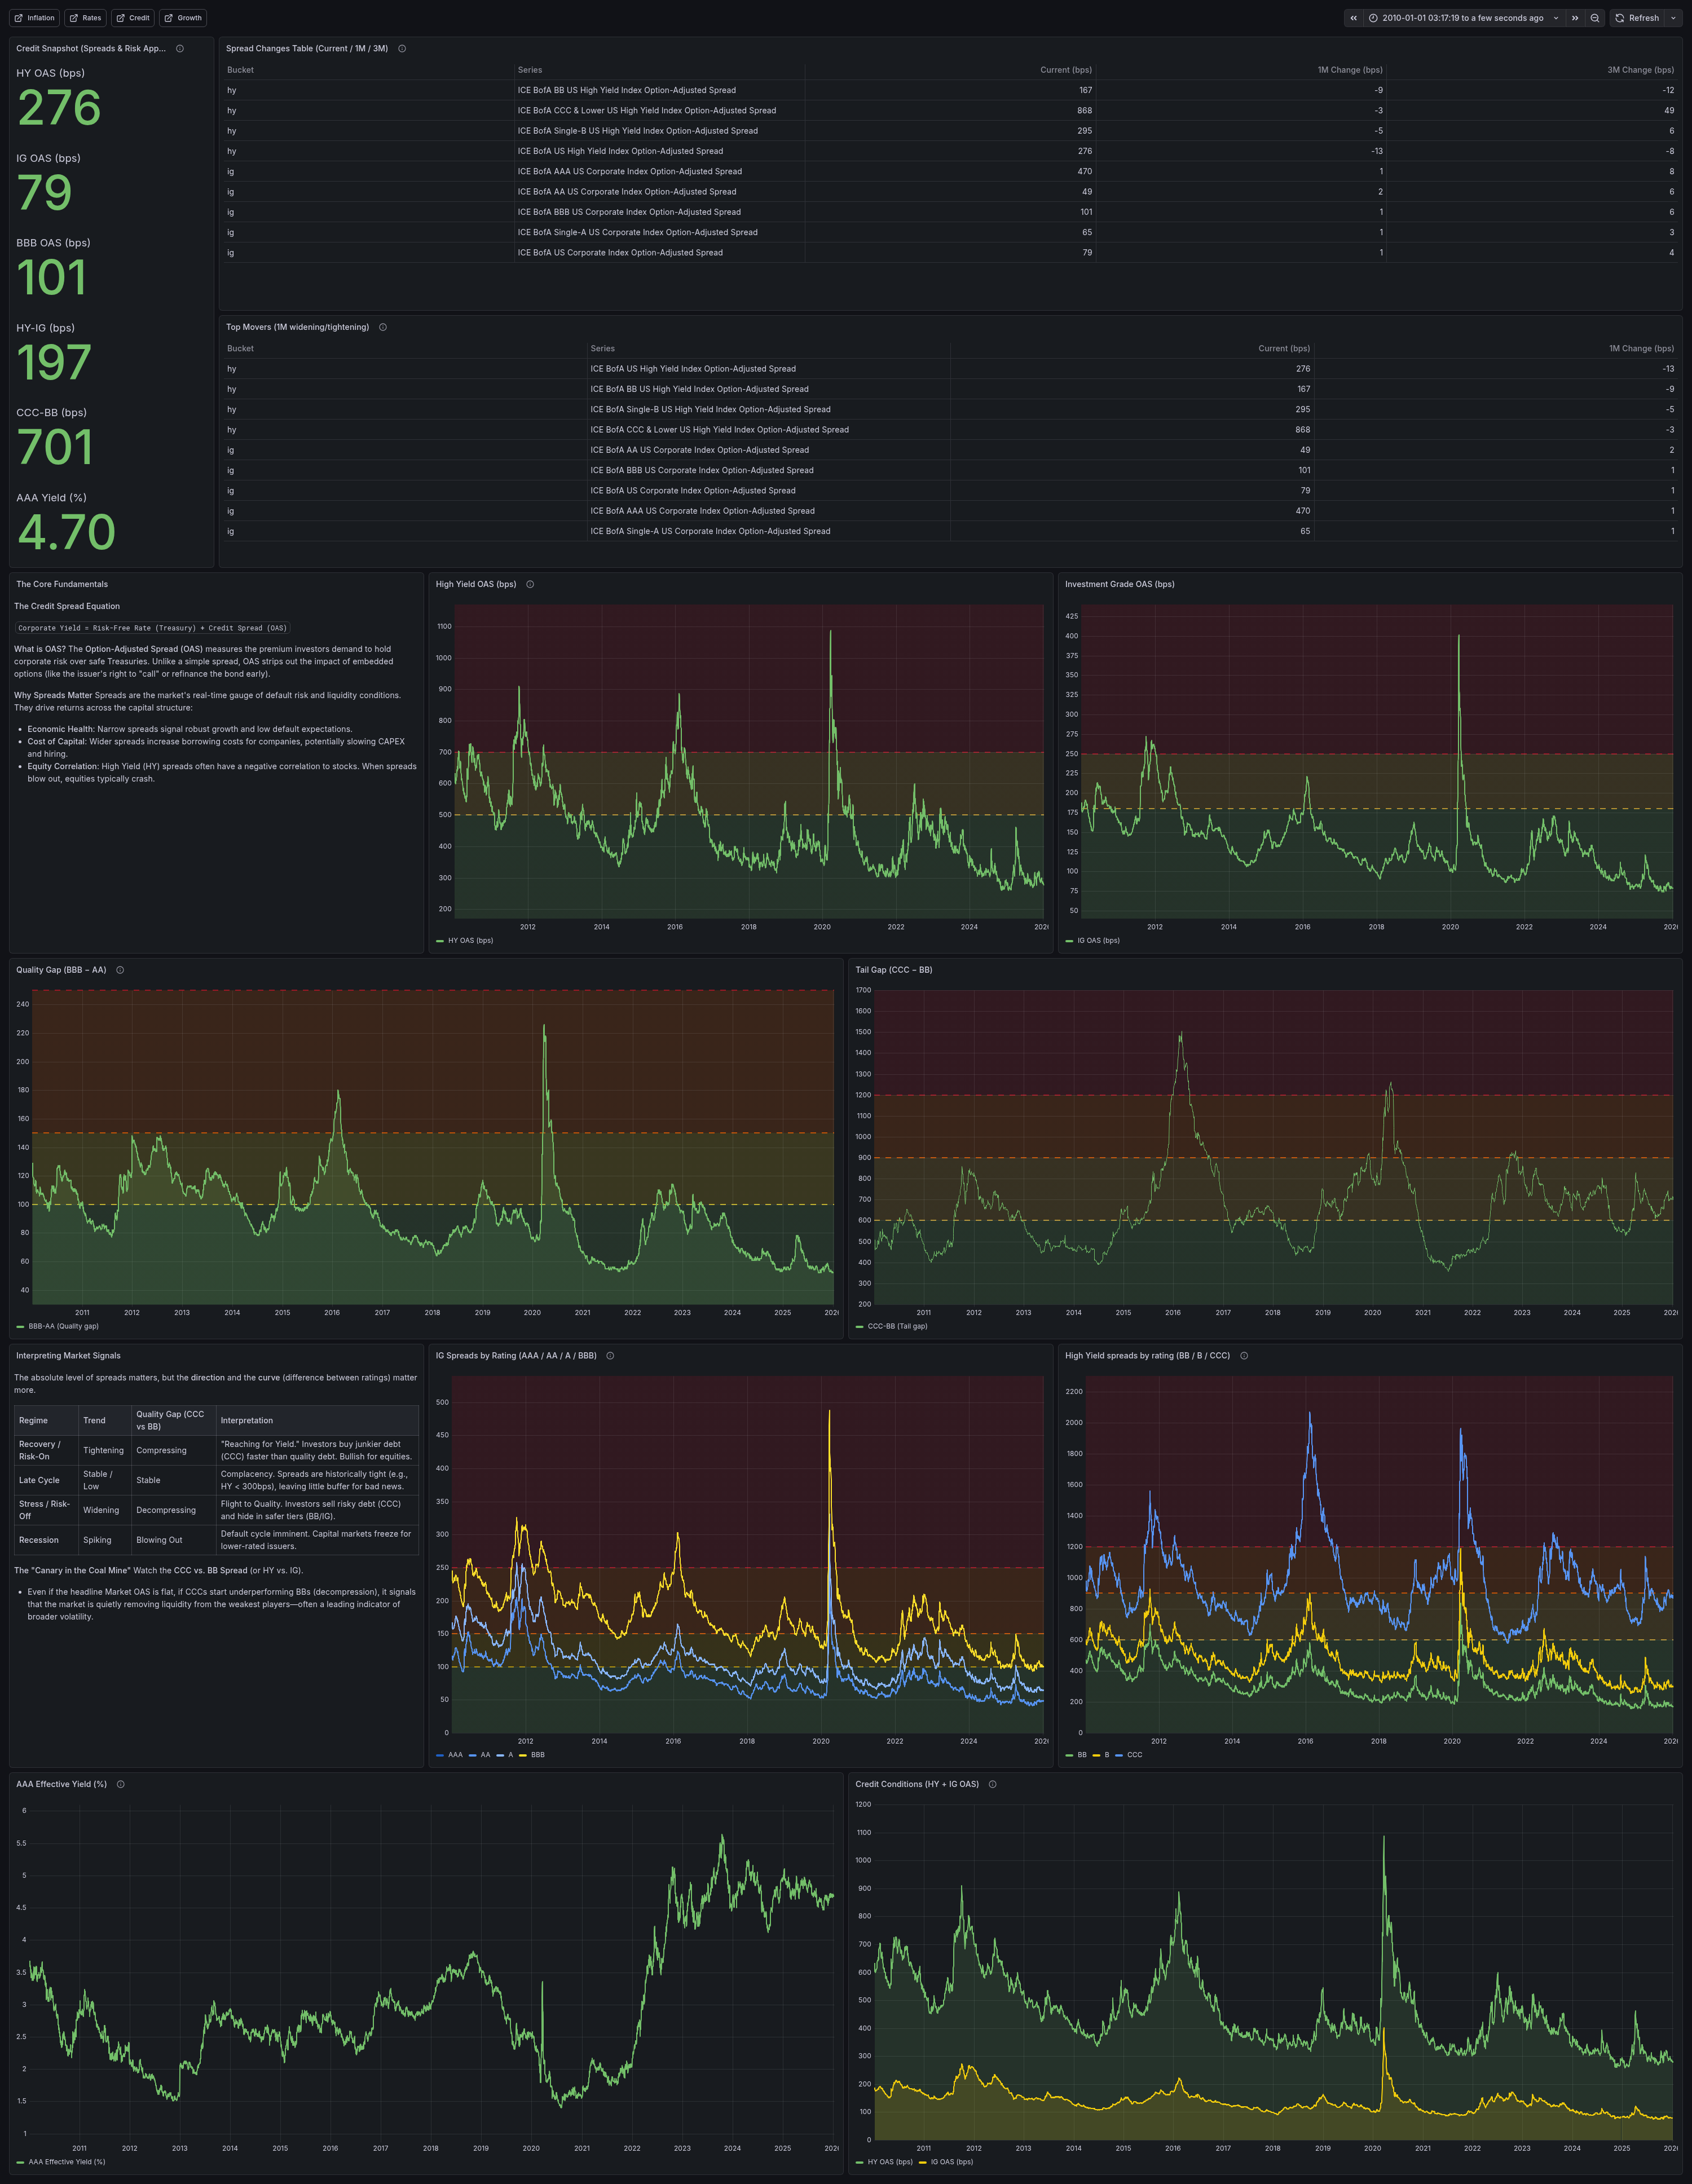
Credit dashboard displaying IG-HY spreads, issuance data, and corporate bond metrics
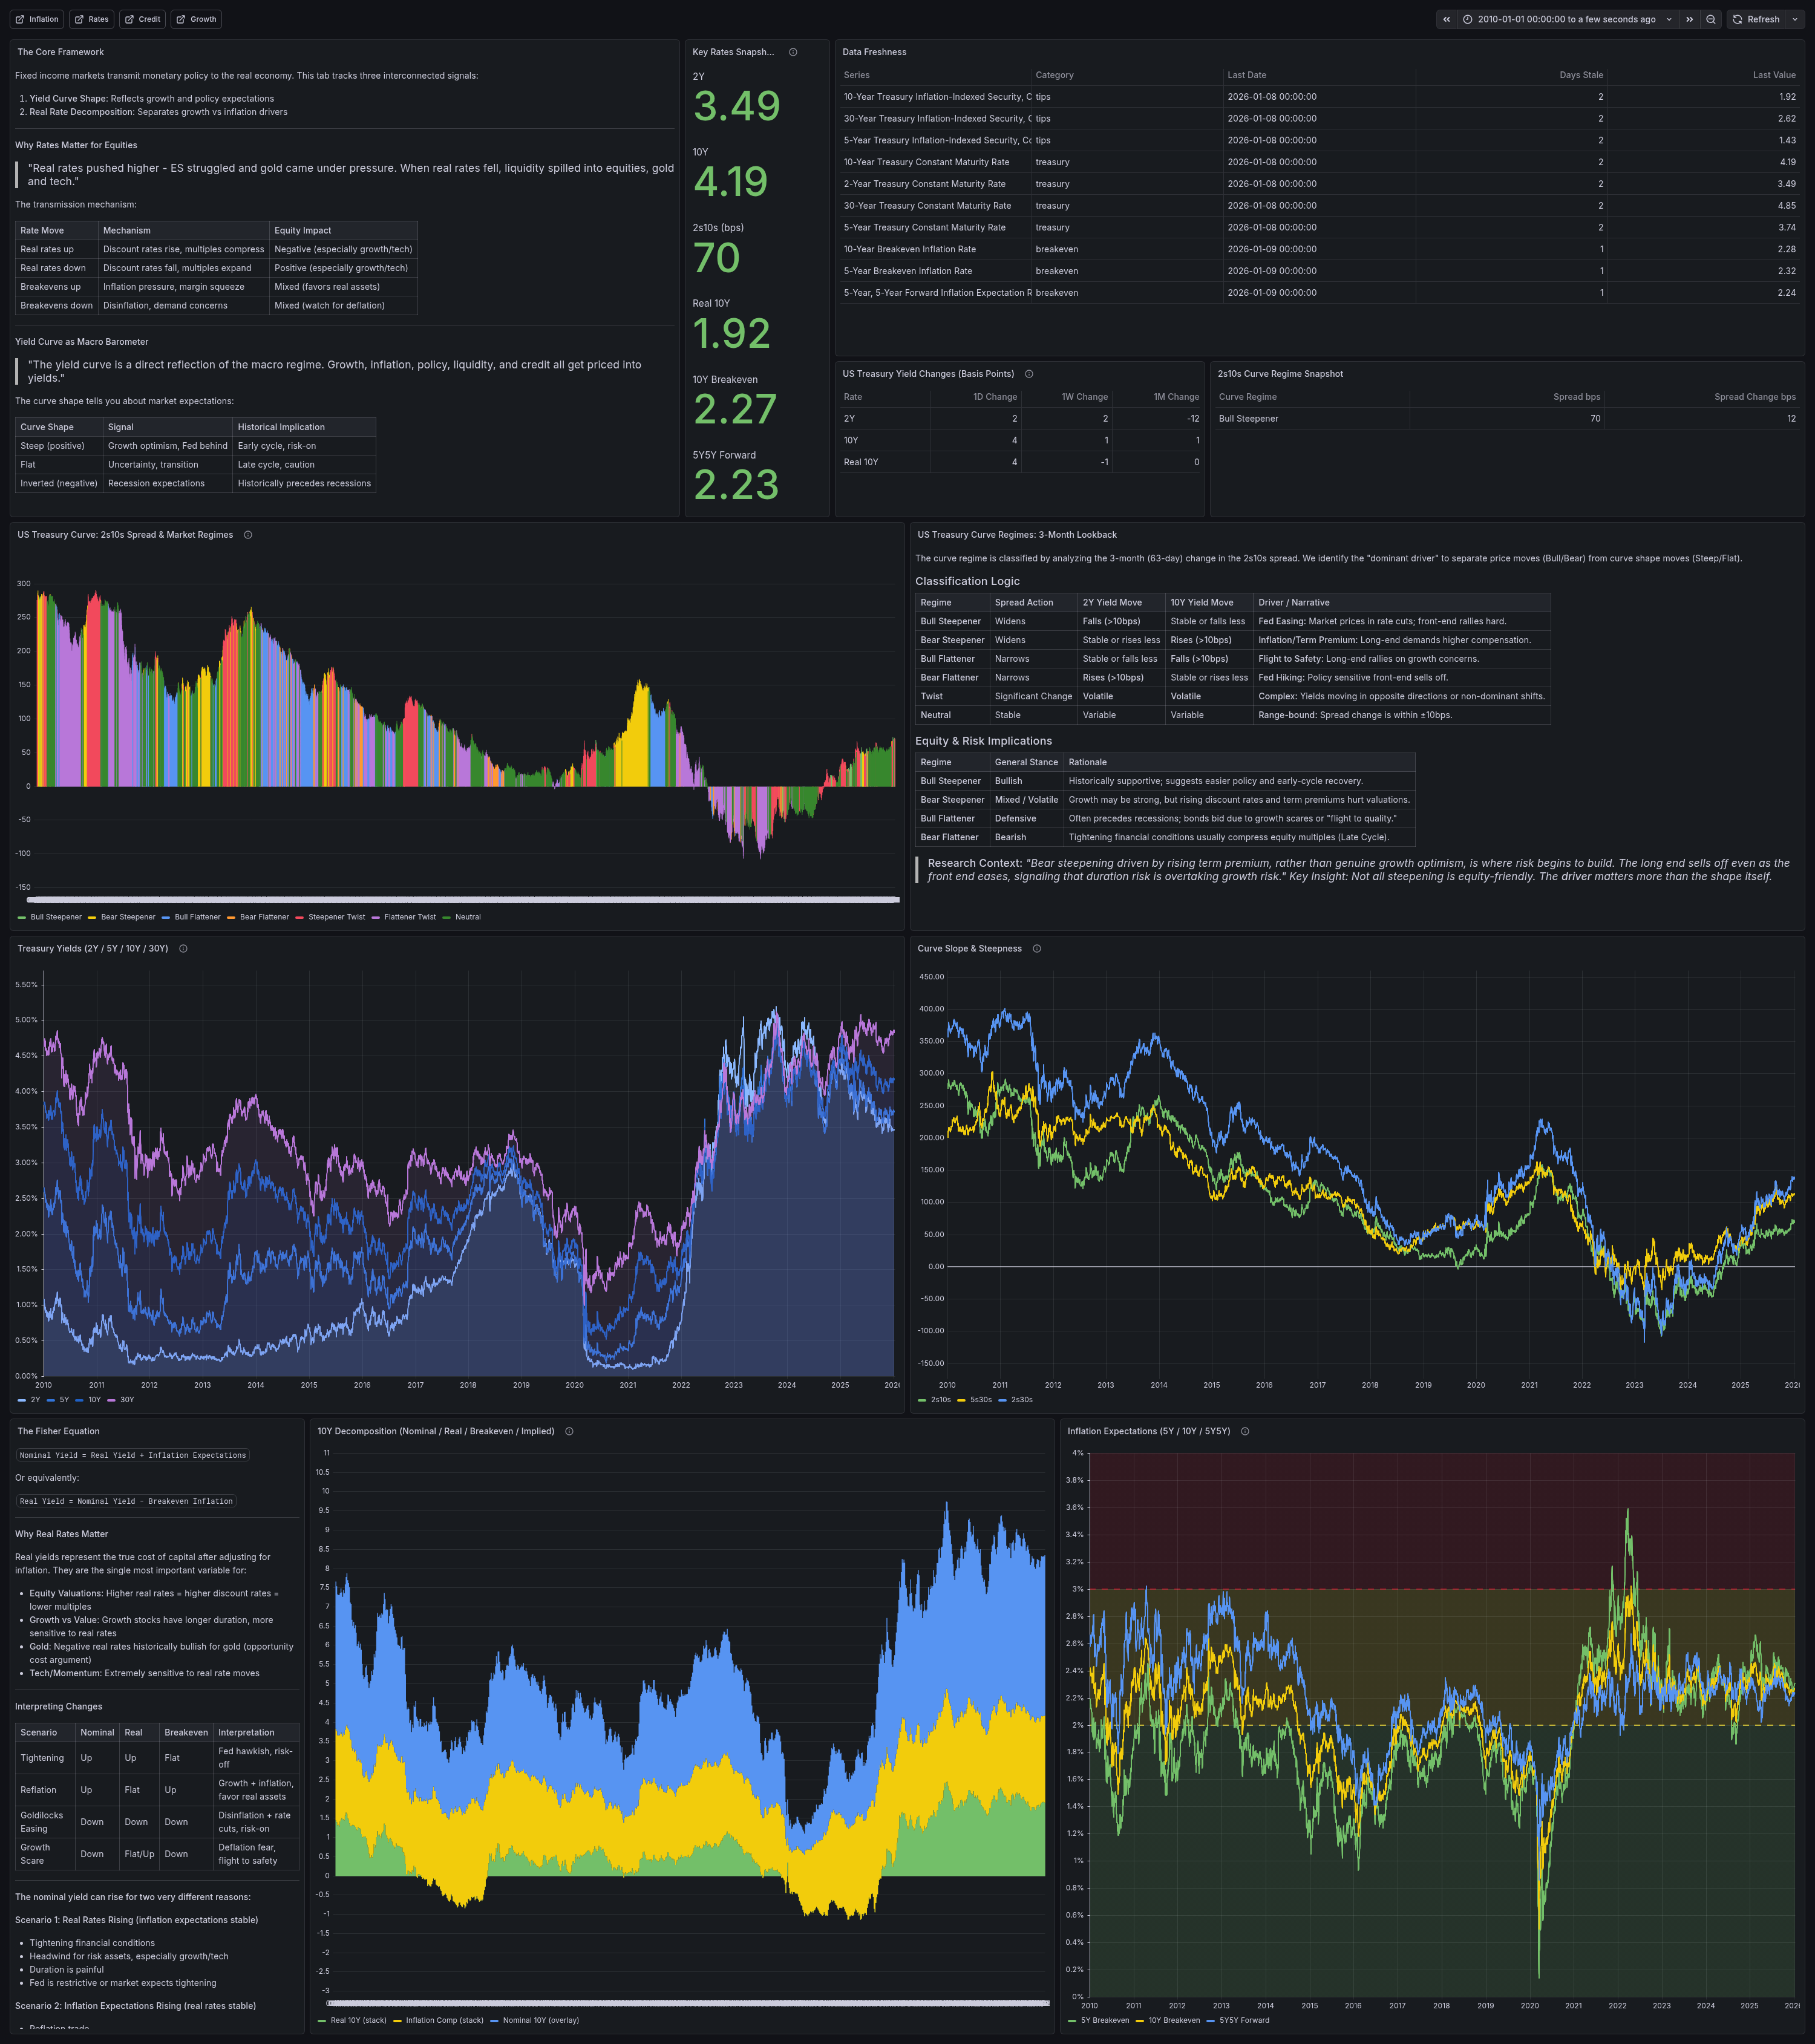
Rates dashboard with Treasury curves, decomposition, and curve regime indicators
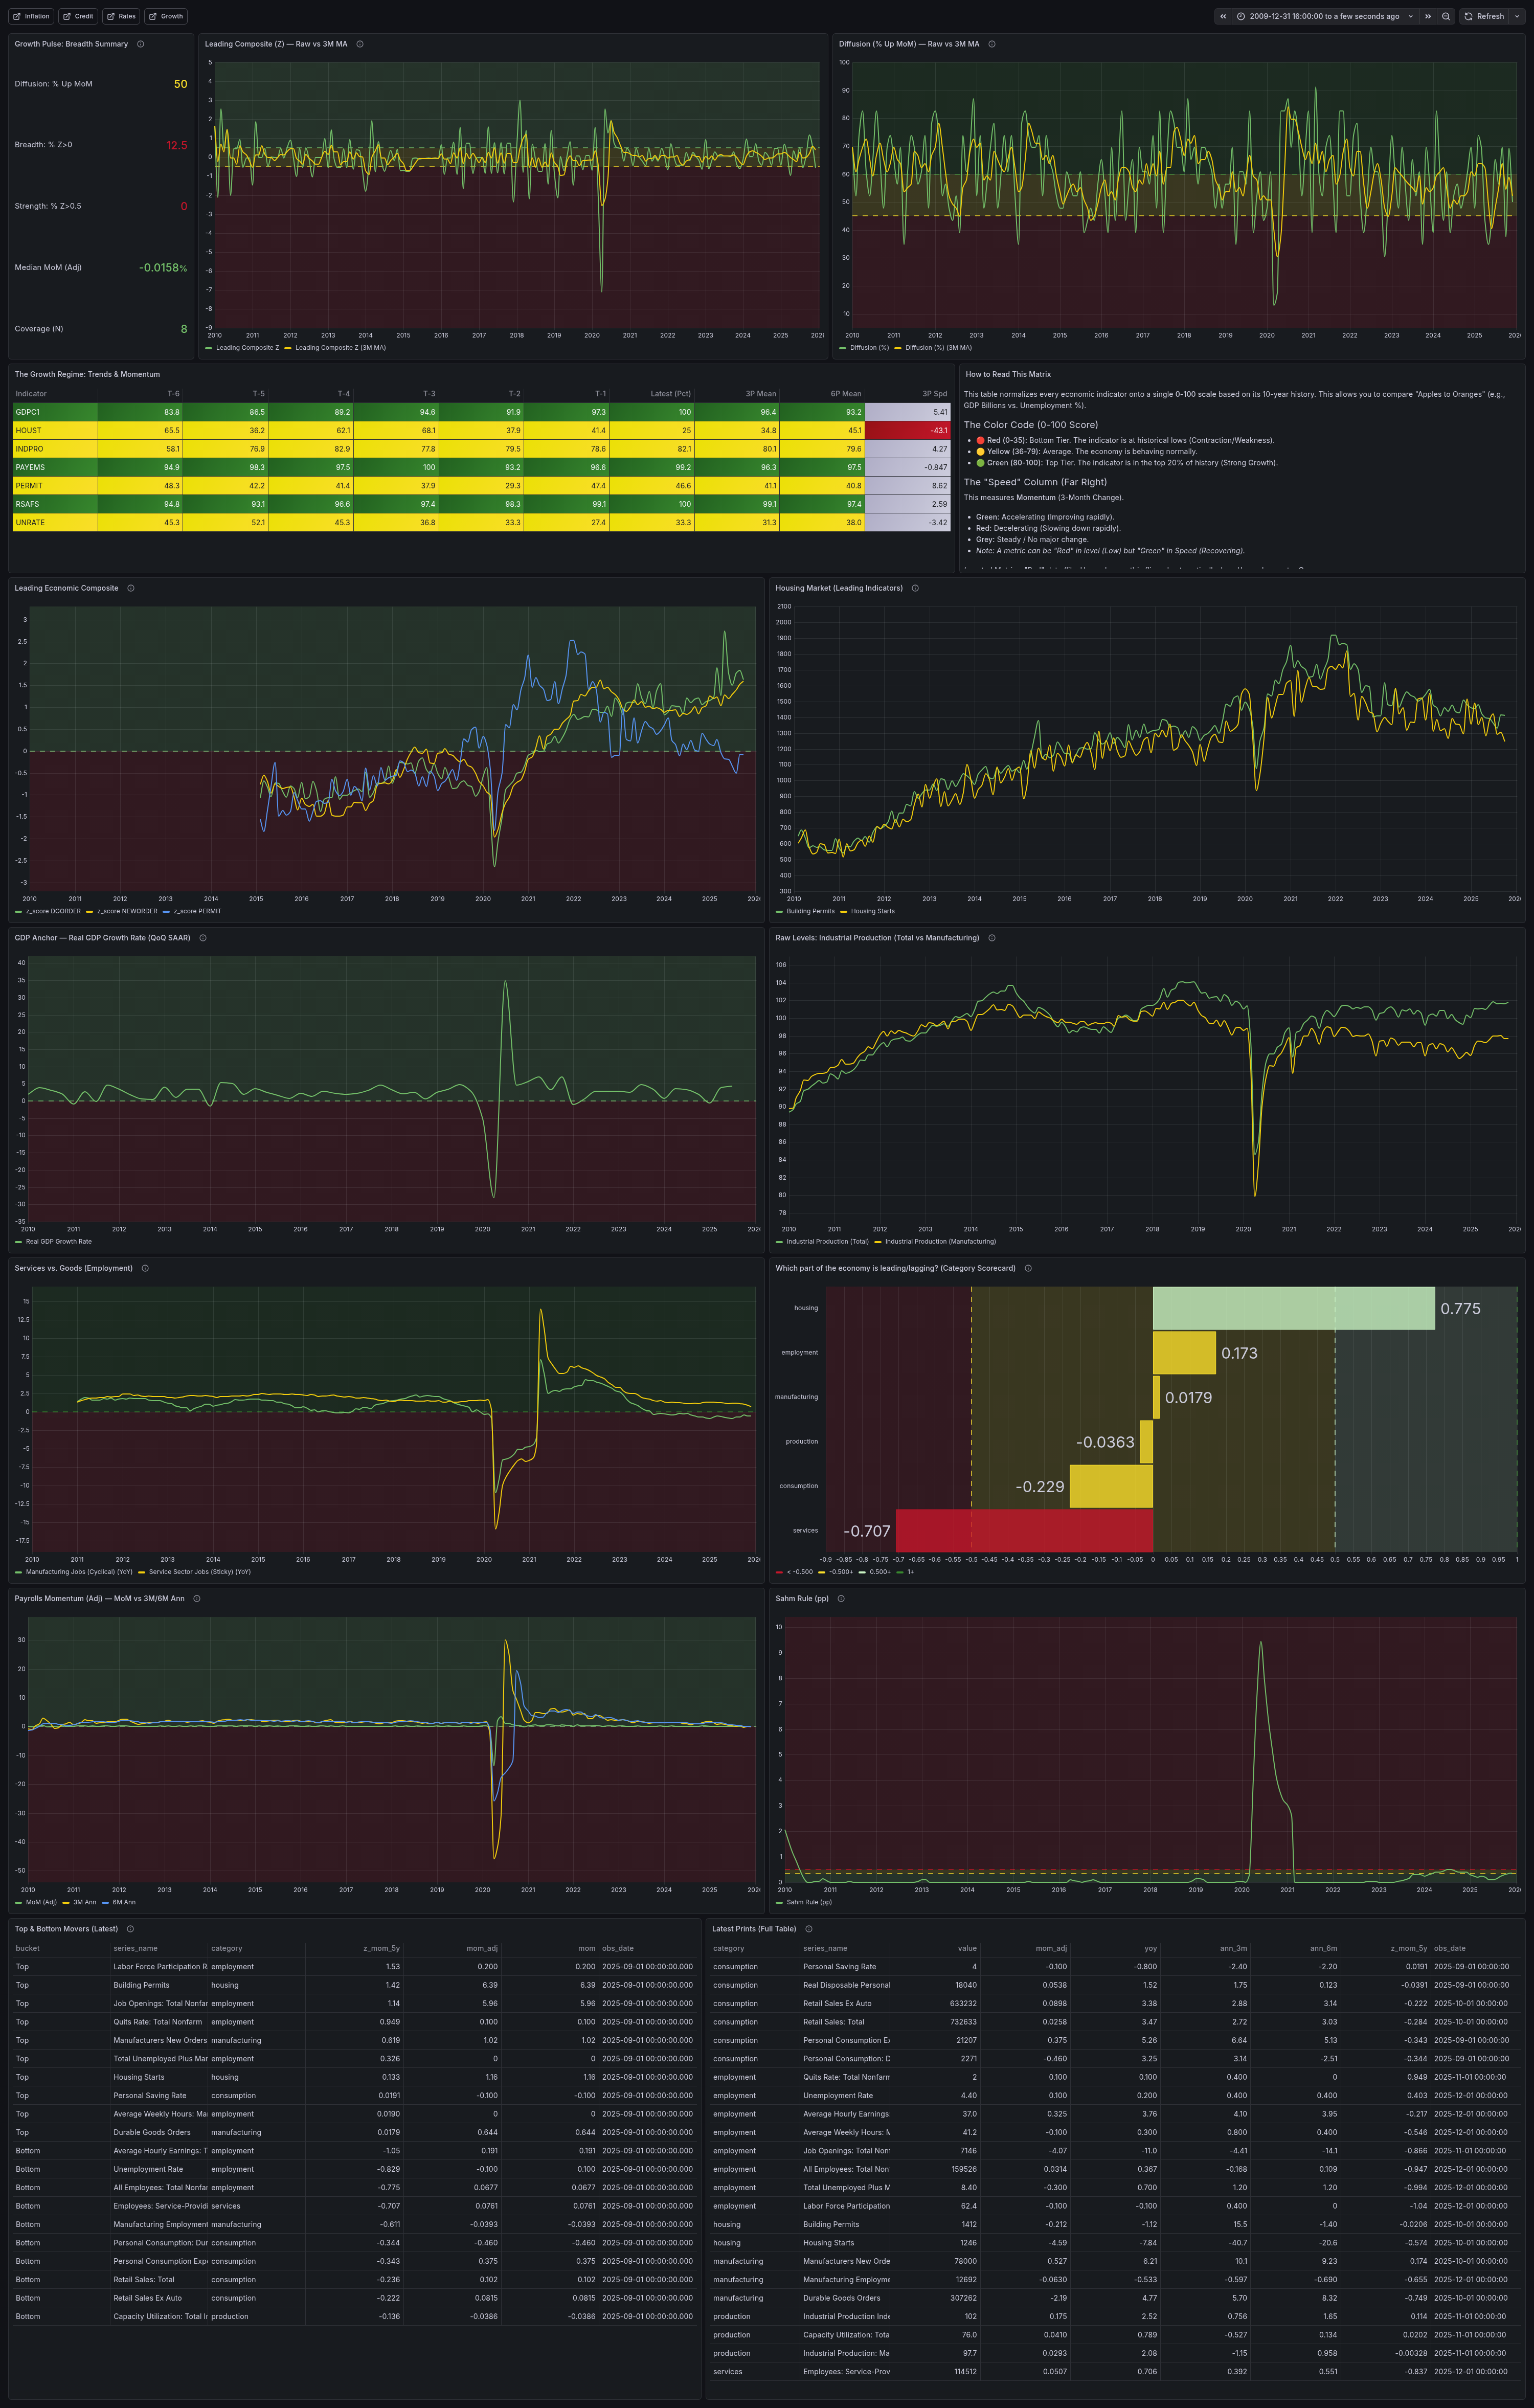
Growth dashboard tracking employment, GDP components, and leading indicators
Why I Built This
As a macro analyst, I wanted access to clean data, keeping it updated, and building a repeatable process.
I first prototyped this as a Streamlit dashboard to explore ideas quickly. It worked, but I realized a real workflow needs a time-series database and a reliable visualization layer.
I also tried building parts of this in Excel, but once you scale to many time series, Excel becomes slow and fragile (large files, long refresh times, and unstable formulas). So I rebuilt it as a production-lite macro data stack: automated ingestion → Postgres → Grafana.
Architecture
Python scripts pull series from FRED based on a catalog table, upsert observations into Postgres, refresh materialized views, and serve analytics to Grafana. Daily cron job handles automated updates with idempotent upserts.
Stack: Python • PostgreSQL • Grafana • Docker • FRED API • DigitalOcean